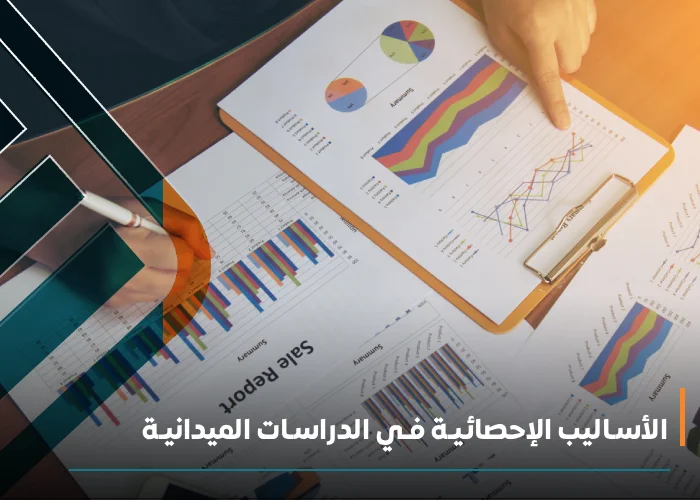
General Program Goal:
Develop the trainees' skills in representing and describing data using statistical indicators to prepare statistical reports efficiently and effectively.
Capabilities the Program Aims to Develop:
Equip the trainee with the ability to prepare statistical reports using descriptive methods efficiently and effectively.
Objectives:
-
Preparing the statistical report.
-
Preparing frequency tables.
-
Preparing graphical charts.
-
Measures of central tendency.
-
Measures of dispersion.
Outcomes:
It is expected that after completing the training, the trainee will be able to:
-
Prepare frequency tables.
-
Prepare graphical charts.
-
Calculate measures of central tendency.
-
Calculate measures of dispersion.
About course
In the world of scientific research and field studies, preparing statistical reports is one of the essential skills that cannot be overlooked. Statistical reports are a powerful tool for analyzing data and presenting results in an organized and clear way, helping in making informed decisions based on reliable information. This course aims to provide you with the knowledge needed to learn how to prepare statistical reports using advanced statistical software such as SPSS and Excel.
In this course, you will learn about different types of statistical reports, such as descriptive and analytical reports, in addition to learning how to collect, organize, and analyze data using appropriate statistical tools. We will also cover how to present data visually using charts and tables, as well as how to write recommendations based on the results obtained.
Whether you are a beginner researcher or a professional in the field of statistics, this course will equip you with the necessary tools to produce accurate and professional statistical reports that help you achieve your research goals.
Types of Statistical Reports
Statistical reports are one of the basic tools in scientific research and field studies, as they provide a systematic way to analyze data and interpret results. The types of statistical reports vary depending on the purpose of the report and the nature of the data studied. In this article, we will review the main types of statistical reports and how to use them effectively in scientific research and other fields.
-
Descriptive Reports
Descriptive reports are among the most common types of statistical reports. The goal of this type of report is to provide a comprehensive summary of the collected data using descriptive statistical methods like averages, medians, modes, and standard deviations. This type of report is used to clarify the main patterns in the data and helps in comparing data between different groups.
-
Analytical Reports
Analytical reports are used in advanced statistical analysis, which involves examining data using inferential statistical tests such as the t-test, ANOVA, and Chi-square test. This type of report aims to analyze relationships between different variables and test hypotheses using statistical methods to determine whether the differences between groups are statistically significant.
-
Predictive Reports
Predictive reports use statistical models like regression and time series models to forecast future outcomes based on past data. This type of report is ideal for fields that require predicting future trends, such as market analysis, sales forecasting, and financial planning.
-
Comparative Reports
Comparative reports are used to compare different groups or categories. Data is analyzed using statistical tests that help compare averages or differences between groups. This type of report is ideal for field studies where different variables, such as environment or time, affect a group of individuals.
-
Interactive Reports
Interactive reports involve analyzing data in a flexible manner using advanced technological tools like dashboards and interactive software that allow users to interact directly with the data. This type of report is ideal for work environments that require continuous data updates or real-time interaction with variables.
The type of statistical report used depends on the objective of the analysis and the nature of the available data. From descriptive reports that focus on summarizing data to analytical reports that include complex tests, each type provides a systematic approach to analyzing data and extracting results accurately.
If you want to learn how to prepare statistical reports professionally and use the appropriate statistical methods in field studies, don’t hesitate to register in Bader Center's courses that offer comprehensive training to develop your skills in this field.
Stages of Preparing a Statistical Report
Preparing a statistical report is an organized process that requires precise steps to ensure that the data is analyzed and presented correctly and professionally. Statistical reports are essential tools in field studies and scientific research, as they help in analyzing data and interpreting results in a way that contributes to making informed decisions. In this article, we will review the stages of preparing a statistical report and how to successfully implement each stage.
-
Data Collection
The first step in preparing a statistical report is data collection. Data collection is an essential process in any study or scientific research. At this stage, the sources from which data will be collected are determined, such as surveys, interviews, or other field tools. It is important to ensure that the data collected is accurate and comprehensive to avoid any bias in later analysis.
-
Data Organization
After collecting the data, the next stage is organizing the data. This stage involves arranging the data into tables and lists that make it easier to analyze using statistical software like SPSS and Excel. At this stage, the data classification and storage methods are defined to facilitate the analysis process. Graphs and charts can also be used to illustrate the overall distribution of the data.
-
Data Analysis
The third stage in preparing a statistical report is analyzing the data. In this stage, various statistical methods such as averages, medians, and standard deviations are applied to understand the general distribution of the data. This stage may also include statistical tests such as the t-test and ANOVA to test hypotheses and ensure statistical significance between the studied variables.
-
Writing the Report
After completing the analysis, the next stage is writing the statistical report. At this stage, the results are presented in an organized and readable format. The report usually includes an introduction explaining the study objectives, followed by the statistical methods used, then the results and interpretation, and finally, the recommendations based on the statistical analysis. The report should be written in a clear and precise manner, with transparency in presenting the data and results.
-
Reviewing the Report
Finally, the reviewing stage takes place. At this stage, the report is checked to ensure its accuracy and free from calculation or interpretation errors. The review may also include rephrasing the results or adding additional details to clarify certain ambiguous points. It is also preferred to have someone else review the report to ensure the clarity and accuracy of the information.
The stages of preparing a statistical report include data collection, organization, analysis, writing the report, and reviewing it. Each of these stages is essential in field studies and scientific research to ensure that the results obtained are accurate and reliable. By using appropriate statistical methods, researchers can prepare statistical reports that contribute to making informed decisions.
If you want to learn how to prepare statistical reports professionally, you can join Bader Center's courses that provide you with full training to use statistical software in field studies. Start now and improve your skills in preparing statistical reports with Bader Center!
Best Content for a Statistical Report Preparation Course
Preparing statistical reports is an essential part of scientific research and field studies, as it helps in analyzing data and presenting results accurately and professionally. In this course, we will cover the advanced tools and methods used in preparing complete statistical reports, from collecting data to presenting results and writing recommendations. We will focus on the popular statistical software and how to use them in this process, along with techniques for data collection and analysis.
Tools and Software Used in Preparing Statistical Reports
Using SPSS for Report Preparation
SPSS is one of the most widely used tools for preparing statistical reports. This software allows easy statistical analysis and is known for its ability to handle large datasets and perform advanced statistical techniques such as hypothesis testing and predictive analysis. SPSS is widely used in field studies and scientific research to generate accurate reports that support decision-making based on data.
Using Excel for Report Preparation
Excel is an important tool in preparing statistical reports and analyzing data. By using statistical functions available in Excel, such as averages, standard deviation, and regression analysis, researchers can quickly and effectively analyze data. Excel is also ideal for presenting data visually using charts and tables, which help in understanding results easily.
Other Tools like R and Python
For more advanced statistical analysis, tools like R and Python are used. These tools offer great capabilities in handling big data and creating predictive models. With advanced statistical libraries such as NumPy and pandas in Python, and ggplot2 in R, researchers can perform complex analyses and generate accurate statistical reports.
Designing Questionnaires for Data Collection
Importance of Questionnaire Design
Designing questionnaires is one of the crucial foundations for data collection, as they allow researchers to gather accurate and analyzable information. Carefully designed questionnaires help reduce errors and ensure accurate results when analyzing data.
Types of Questions in Questionnaires
Questionnaires typically contain closed-ended questions (such as multiple-choice) and open-ended questions (requiring textual responses). Evaluation or ranking questions can also be included to help measure attitudes or opinions.
How to Analyze Questionnaire Results
After collecting data through questionnaires, the results are analyzed using appropriate statistical methods. Statistical software like SPSS and Excel is used to analyze the data and extract conclusions that support the hypotheses.
Presenting Data Visually
Using Graphs
Graphs are an effective tool for presenting data visually. Through graphs such as pie and line charts, relationships between variables can be easily illustrated. This helps in faster and more effective data analysis.
Using Tables
Tables provide an organized view of the data, showing the relationship between variables in a direct and clear way. Tables are an essential tool in preparing statistical reports, as they make it easier for researchers to compare data and draw accurate conclusions.
The Importance of Visual Presentation in Understanding Data
Presenting data visually helps clarify patterns and trends in field studies. Graphs and tables make it easy to understand data, contributing to interpreting results in a way that helps make better decisions.
Writing Recommendations and Results
How to Formulate Recommendations
After analyzing the data, the next stage is writing recommendations. Recommendations should be based on the evidence derived from statistical analysis and help in making practical decisions to improve performance or adjust policies.
Linking Results to Recommendations
It is essential to link the results obtained with the recommendations presented. Recommendations should be based on the results of the statistical analysis to ensure their accuracy and applicability.
The Importance of Recommendations in the Report
Recommendations are a crucial part of the statistical report, as they provide practical guidance based on statistical data. By linking recommendations to results, researchers can guide policies or make decisions that enhance study outcomes.
Ethics in Preparing Statistical Reports
When preparing statistical reports, ethical considerations in scientific research should be taken into account. This includes transparency in presenting data, impartiality in analysis, and ensuring the protection of research participants' data.
Preparing statistical reports is a comprehensive process that involves collecting data, analyzing it, presenting it, and writing recommendations based on the results. By using statistical software like SPSS and Excel, and applying advanced statistical methods, accurate results can be achieved, contributing to better decision-making in various fields.
Start now and enhance your skills in preparing statistical reports with Bader Center!


